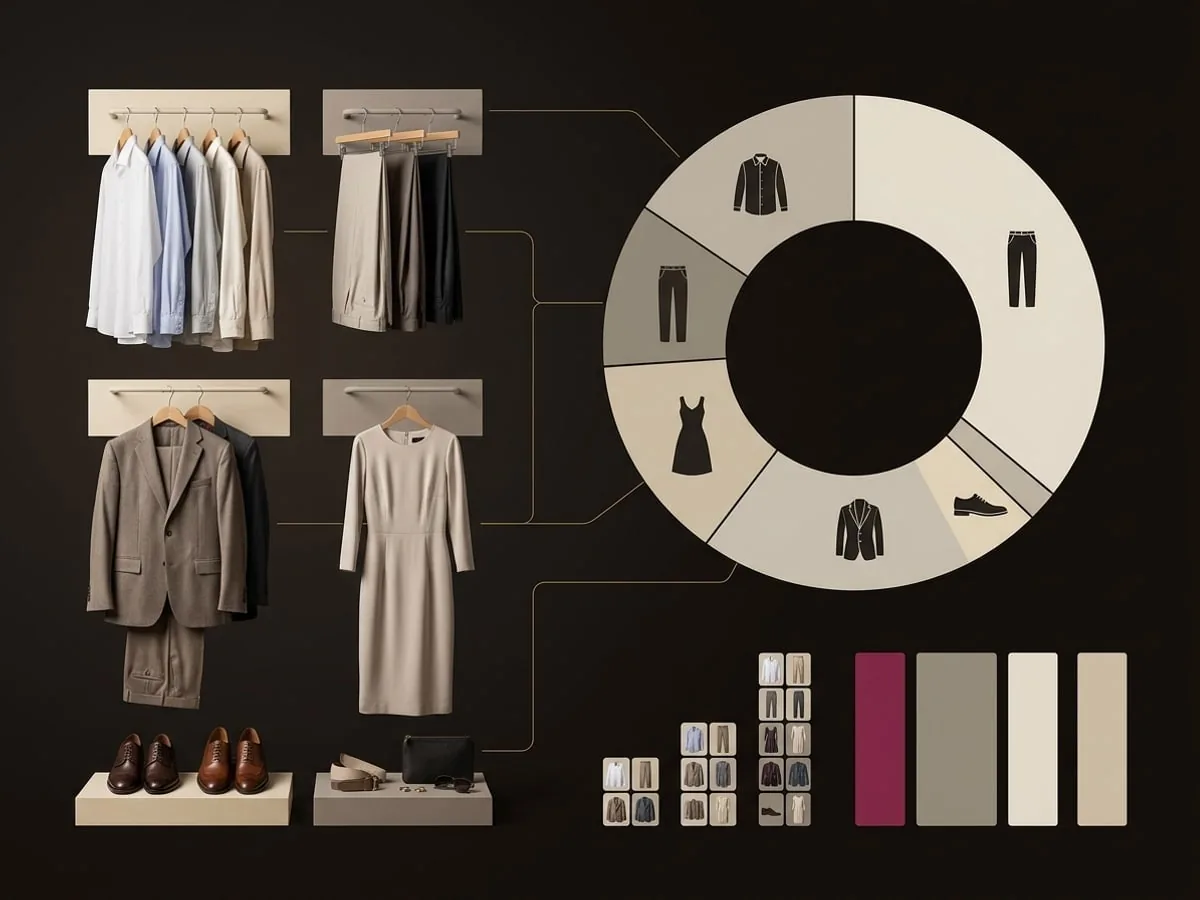
01
Read the proportions
See which categories, colours, styles, vibes, and seasons take up the most space in your closet.
WARDROBE STATISTICS
Category, colour, style, vibe, and season breakdowns built from your own pieces, so you can describe your wardrobe with something better than an impression.
→ 01 / WHAT THE NUMBERS SHOW
Most closets lean somewhere without their owner noticing. Seeing the proportions makes the next decision easier, whether that is what to wear or what not to buy again.
01
See which categories, colours, styles, vibes, and seasons take up the most space in your closet.
02
A ranked breakdown makes a repeated colour or an empty season obvious in a way scrolling a grid never does.
03
Use the real composition of your wardrobe instead of a guess when you plan outfits or consider a purchase.
→ 02 / CLOSET STATISTICS
Each breakdown ranks what you own by share of the closet, which is where the gap between the style you describe and the style you buy becomes visible.
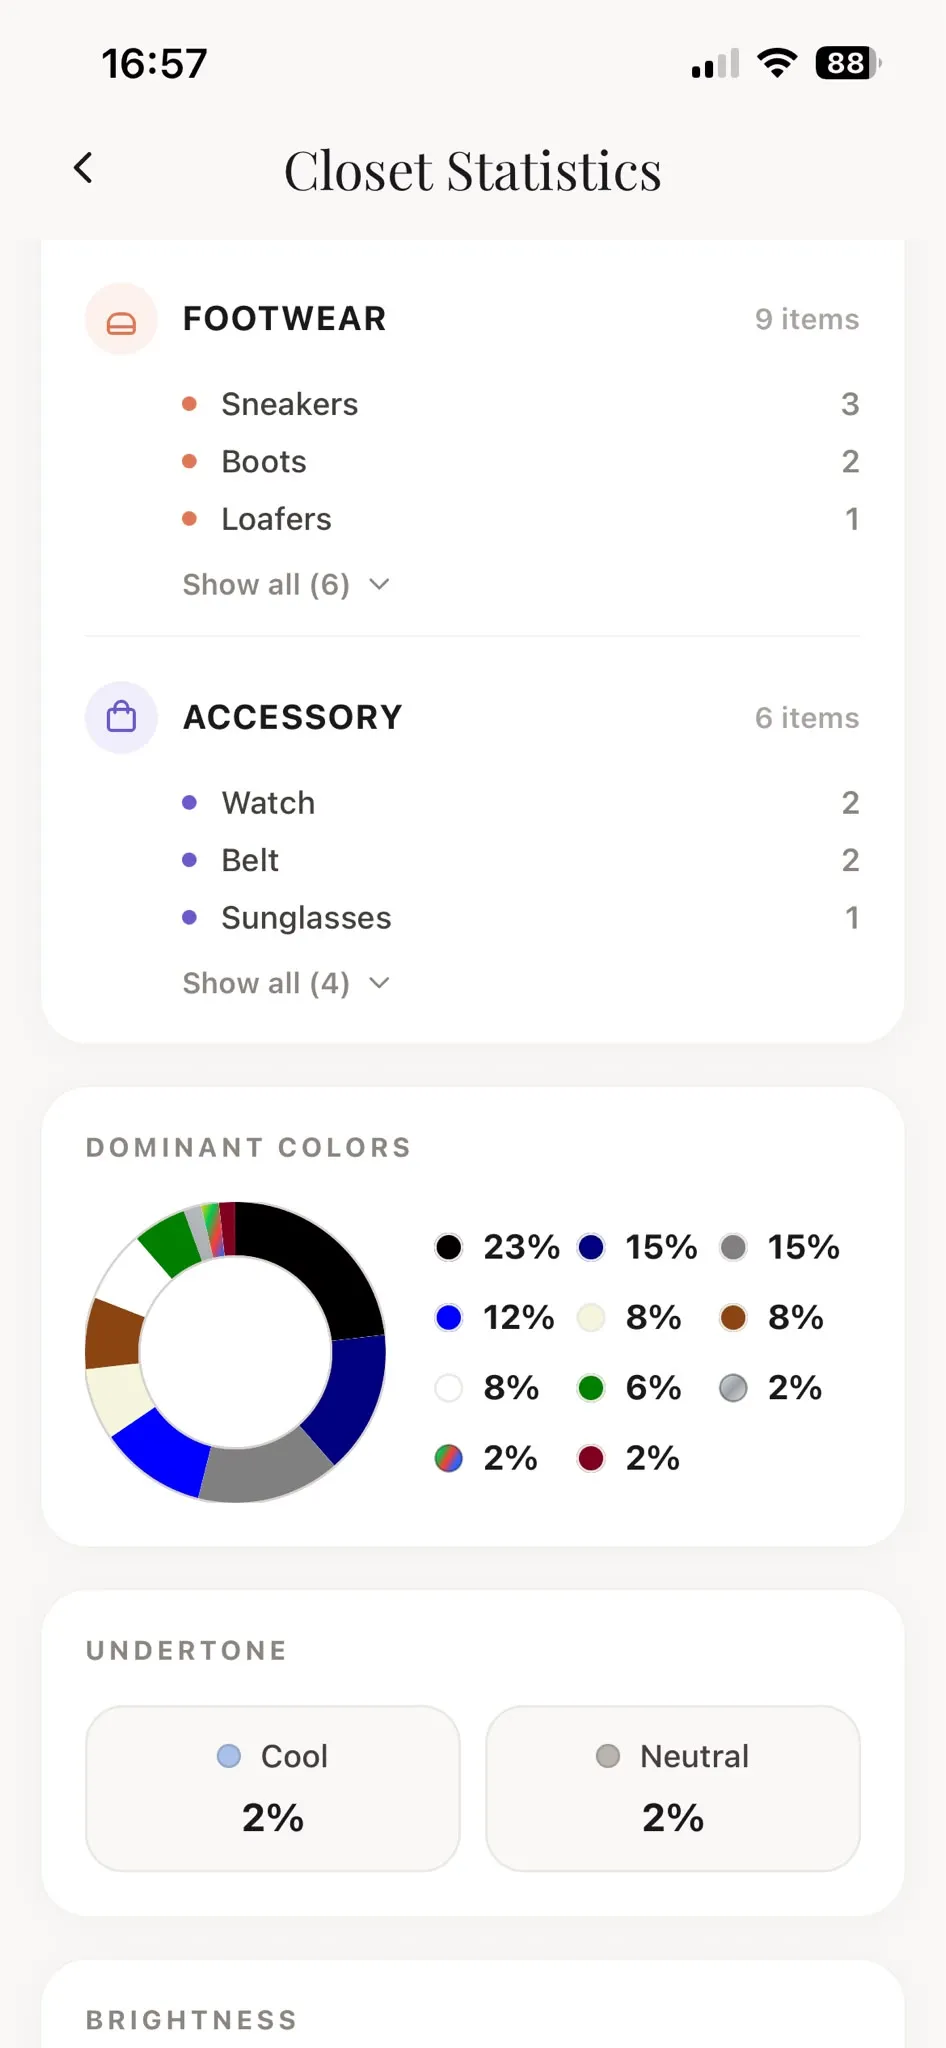
→ 03 / HOW IT WORKS
There is nothing to configure. The breakdowns are a reading of your saved pieces, so they sharpen as the wardrobe fills.
Statistics are built from your saved pieces, so the picture sharpens as you scan more of your wardrobe.
Review your closet by category, colour, style, vibe, and season.
Take a dominant colour or an empty category into an outfit plan or a shopping conversation.
→ 04 / WHAT THE CHARTS MEAN
The breakdowns count what you have saved. They do not rate your wardrobe, rank your style, or suggest that a closet should look a particular way.
Pieces missing from your closet are missing from the charts, so an unexpected result usually means an incomplete wardrobe.
Modesona does not grade your closet. The breakdowns are proportions, not marks.
Each piece counts towards the category, colour, and style saved on it, and you can correct those at any time.
An empty category tells you something about your closet. Whether it is worth filling remains your decision.
→ 05 / QUESTIONS, ANSWERED
What the breakdowns measure, why a number can look wrong, and what to do with the result.
The composition of your saved closet: how your pieces break down by category, colour, style, vibe, and season.
The breakdowns only count pieces you have saved, using the details saved on them. Adding missing clothes or correcting an item’s category or colour changes the result.
No. You get proportions and rankings of what you own, not a rating of your closet or your taste.
They are a good starting point for a closet gap conversation, a packing plan, or deciding whether a piece you are about to buy repeats something you already own.
You are cordially invited
Modesona is your personal stylist — free, instant, and built around everything already hanging in your wardrobe.


Free · No card required · iOS & Android